Statistical evidence rules out the Huanan Seafood Market as the Origin of SARS-CoV-2
New study from Italy leaves less than 1/53 chance for the first case of SARS-CoV-2 infection to be from the Huanan seafood market in Wuhan, China.
There seem to be many different other publications about this paper https://www.sciencedirect.com/science/article/pii/S0013935122013068
which was the newest out of the long series of evidence of SARS-CoV-2 pre-pandemic circulation from before the first official case at the Huanan seafood market on 11 December 2019. Many claims that this finding was “false positive” citing the B.1 mutations found in their sequences and the nested PCR methodology used to generate the positive tests.
However, since this is one of the first papers that show evidence of multiple pre-December-2019 samples testing positive for the presence of SARS-CoV-2 RNA, with a good set of negative controls in the form of both a very large (191 out of their total of 289 samples screened in the paper) control cohort and negative controls (ddH2O) in each amplification, it gives us a unique opportunity to perform statistical analysis on the claim of the paper to determine the probability that the result of this paper was from false positive, or there was indeed a positive signal of pre-pandemic SARS-CoV-2 circulation in the set of pre-pandemic samples they analyzed in this publication.
1: How to quantify the chance of false positivity for a particular test conducted in a study?
According to the study, “Our results provide preliminary evidence that SARS-CoV-2 was already circulating in Northern Italy by late 2019, with the first molecular evidence of infection dating to September 12th, 2019, and no PCR-positive result for any of the 191 samples collected before this date.” and “Additionally, it never occurred that two samples processed next to one-another, including those next to positive controls, tested positive.”. This indicates that no positive test results were found in the negative control cohort and no evidence of cross-contamination between consecutive samples tested within this study.
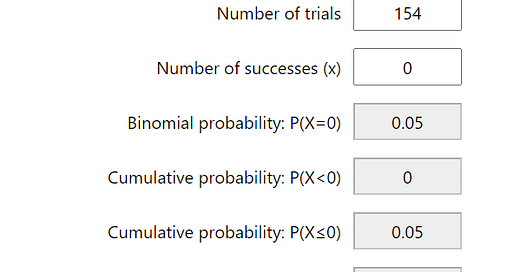
When there were no positive results from the control cohort, it become possible to estimate the maximal rate of false positivity for the tests used in the study using Binomial Probability Calculation. In order to find the chance of false positivity within the tests used such that for 95% of the time the random sampling of the negative control cohort yield more than 0 positive results (e.g., the 95% C.I. limit of the false positive rate), it is as simple as using the Binomial Probability Calculator to find the Probability of success for a trial such that P(X=0) is 0.05 (1-0.95). For the 3 genomic regions tested in all of the 191 control cohort samples, this chance of false positive is about 0.015562 or 1.5%, For all 4 genomic regions tested in the subset of (191-(289-252))=154 samples, the estimated false positive rate for P(X=0) = 0.05 is 0.019265 or 1.92%.
Now, for the number of positive samples found in the cohort of patients where SARS-CoV-2 RNA was found (a total of 289-191=98 samples, where it was unclear how many samples belonged to the pre-pandemic period and how many samples belonged to the pandemic period), Table 1 indicates that 5 samples from before 01 December 2019 tested positive for one of the 3 hemi-nested PCR assays and 7 samples before 01 December 2019 tested positive for one of the 4 hemi-nested PCR assays. We will take 98 as the maximum number of possible samples from the pre-pandemic period in order to calculate a worst-case scenario (which is technically higher than the highest possible pre-pandemic samples screened using the nested PCR assays, as two out of the 13 positive samples were attributed to patients from the pandemic period in table 1).
For both worst-case scenarios, the likelihood that all of the 5 positive samples from before 01 December 2019, screened for the first 3 hemi-nested PCR assays (other than Spike B), being false positives, is 0.01883 or 1/53.11, whereas the likelihood that all of the 7 positive samples from before 01 December 2019, screened for all of the 4 hemi-nested PCR assays being false positives, is 0.00296 or 1/337.84. In both cases, the likelihood of all these tests being the result of false positives was well below 5%, and the signal is considered statistically significant at >2 sigmas and ~3 sigmas, respectively.
2: The sequence of the amplicons
The authors of this study also performed the sequencing of the amplicons. Two of the samples were found to contain mutations away from the B.1 reference used: “One sequence (case ID #5) contained two additional non-synonymous mutations in NsP3, unique in our dataset, T2987C (F908L) and T3012C (L916S), whose significance is unclear. Interestingly, the simultaneous presence of multiple variants was noted in one patient (case ID #10) as two double peaks were observable in the electropherograms of the S sequences: 23000C/T and 23222G/A”
Case ID #5 is from Brescia, sampled on 22 October 2019, and sera obtained from the case neutralized the virus to up to 62% PRNT at 1/10 dilution.
Case ID #10 is from Milan and is sampled on 09 January 2020.
Samples of SARS-CoV-2 genomes from GISAID before the end of the year 2020 were obtained from http://preearth.net/pdfs/ids-cdate-sdate-name-country-mutations.txt, whereas the NextStrain database was searched for both the Open and the GISAID database for all 3 provided time ranges.
T2987C was only found in the U.K., whereas T3012C was not found on either NextStrain or from the pre-2021 GISAID dataset. A more thorough literature search revealed that T2987C was also found within the Myocardial tissue of an Autopsied Eucador patient, whereas T3012C was not found in any other literature.
T23000C was not found on either the pre-2021 GISAID dataset or the NextStrain dataset, whereas G23222A was found in a single genome from Guinea. A literature search of these mutations did not return any results.
The uniqueness of these nucleotide sequence changes, and the fact that these sequences were distinct from the other amplicons generated from the same experiment, mean that it is extremely unlikely that these amplicons originated from their positive control sample—supposedly “RNA isolated from a SARS-CoV-2-positive patient”.
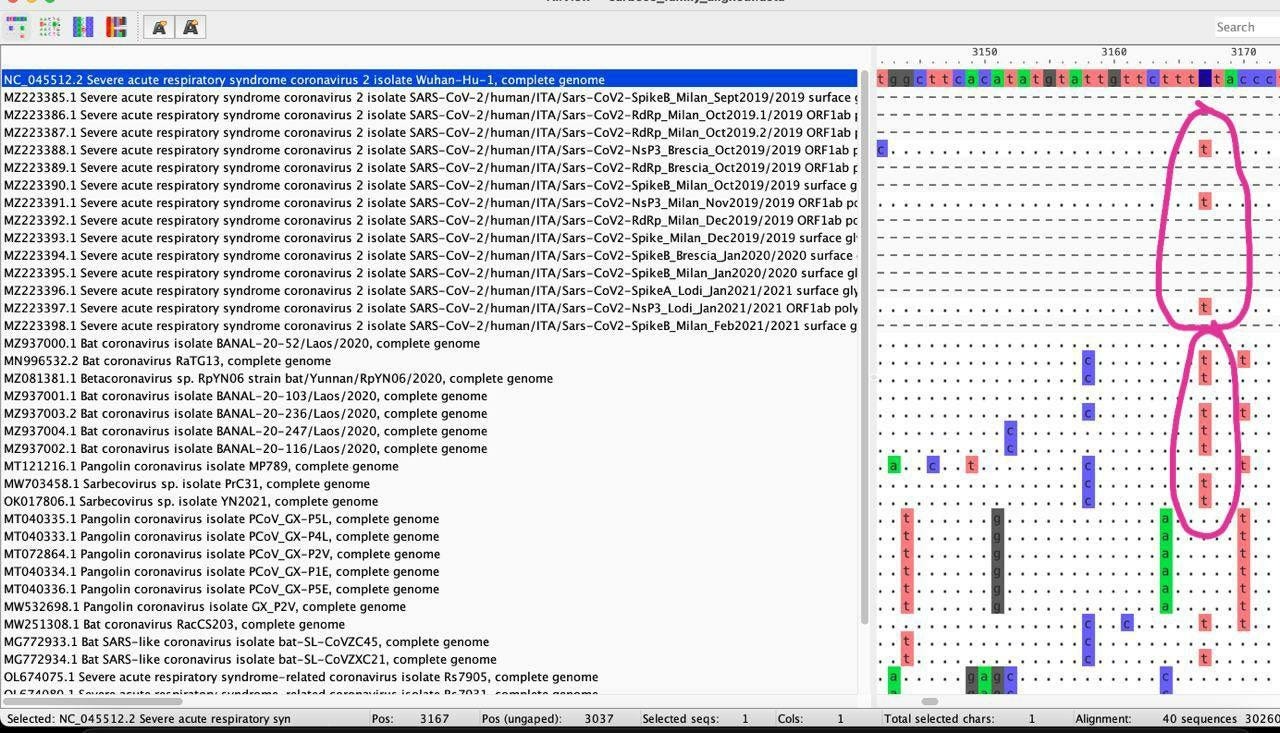
Interestingly, nucleotide position 3037T is in fact observed in more than half of all the bat-derived coronaviruses that were closest to SARS-CoV-2 and was originally considered a mutation leading up to the bat outgroup for the global SARS-CoV-2 phylogenetic network.
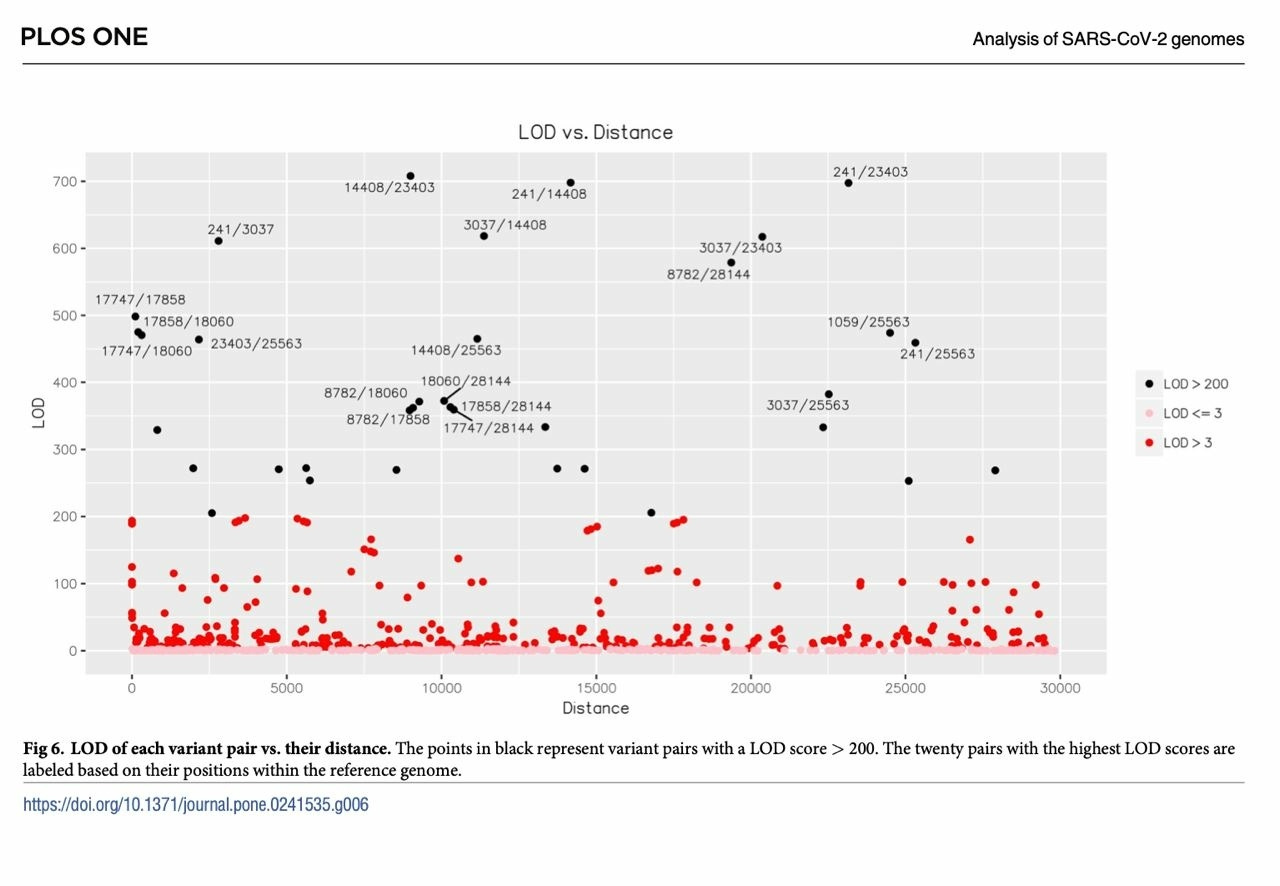
As there exist strong epistasis between 241,3037,14408 and 23403 during the circulation of SARS-CoV-2 within Humans, it cannot be ruled out that genomes carrying 241/3037/14408/23403TTTG and 241/3037/14408/23403CCCA may have diverged early on during the initial circulation of SARS-CoV-2 in humans. Given that neither 2987C nor 3012C were found within Italy on NextStrain or the pre-2021 GISAID dataset, and the fact that 3037T is found in most of the closest bat-derived relatives of SARS-CoV-2, the presence of 3037T, 14408T, or 23403G within these amplicon sequences could no longer be used to simply rule out these amplicons as being “non-ancestral”.
3: Serological testing results
4 out of the 7 patients that tested positive for SARS-CoV-2 RNA between September 2019 and November 2019 were also found to harbor antibodies targeting SARS-CoV-2. Of these samples, Case ID #1 was positive for IgM and IgG, Case ID #4 was positive for IgA and IgG, whereas Case ID #5 and Case ID #6 were positive for IgM only. Case ID #5 was also found to harbor neutralizing antibodies that lead to 62% PRNT at 1/10 dilution.
4: What was causing the measles-like rash in Northern Italy without a measles diagnosis, especially since September 2019?
Perhaps one of the most problematic and hard-to-explain-as-false-positivity results of the paper was figure 1: a chart of patients being admitted to the Measles virus reference lab since the year 2017. The percentage of discarded measles/rubella suspected cases (that is, a measles-like rash that tested negative for measles or rubella virus) fluctuates between 10% to 50% across the two years between 2017 and 2018, whereas the highest percentage was consistently about ~45%-50% in the October-December period. The percentage of such cases fluctuates around 20% for the July-September period. These observations allow us to establish a baseline on the rate of similar morbilliform eruptions that would be ultimately caused by other causes (e.g. measles/rubella negative).
Three observations can be made for the data since July-September 2019: 1. The number of cases presented to the reference laboratory was not significantly distinct between the July-December 2019 period and the similar periods of decreased morbilliform eruption cases presented to the laboratory in prior years. 2. There was a much greater percentage of cases that tested negative for measles and rubella beginning in July 2019, unprecedented from prior years. Discarded cases form 60% of all presented cases in July-September 2019 and nearly 100% of all cases from October-December 2019. 3. Since the beginning of the pandemic, >60% of all cases presented to the laboratory tested negative for Measles or Rubella.
These 3 observations are indicative of a novel pathogen, distinct from the pathogens that cause discarded morbilliform eruption cases in 2017 and 2018, causing the same morbilliform eruption symptoms beginning in September 2019, and continued to do so since the official beginning of the pandemic in 2020. It is therefore highly likely that this pathogen was the same pathogen that causes this observation during the pandemic.
Why not the lungs?
One of the main critiques of the theory that SARS-CoV-2 was circulating in Italy prior to the observed pandemic, is the apparent absence of excess deaths or pneumonia deaths prior to the official start of the pandemic. However, this is negated if the original Strain of SARS-CoV-2 circulating in this pre-pandemic period is distinct from the strain of SARS-CoV-2 that was causing severe pneumonia cases in Wuhan.
https://academic.oup.com/bib/article/22/2/1096/6137178
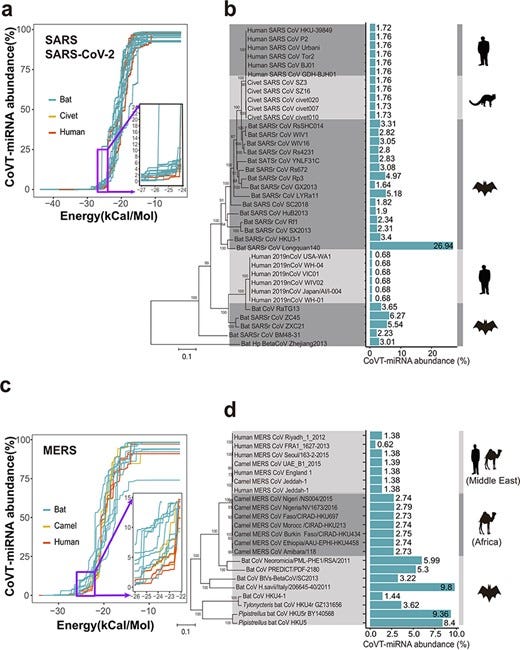
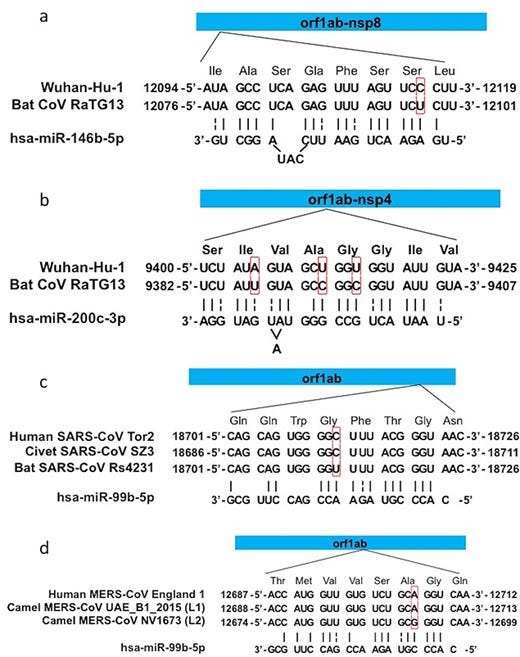
One of the unusual features of SARS-CoV-2 is its extremely low abundance of human host MiRNAs that will target its RNA genome, the lowest observed for any Sarbecovirus, and its ability to evade the human lung-specific antiviral MiRNAs, MiR-146b, and MiR-200c.
Alignment of MiR-146b and MiR-200c to the SARS-CoV-2 genome indicates that one targeted position 12094-12119 while the other targeted position 9400-0425. a BLAST search of these 2 locations from the November 27 2019 dataset in PRJNA679821 (from https://www.sciencedirect.com/science/article/pii/S0048969721012651) indicate that neither position was covered, whereas none of the known pre-pandemic SARS-CoV-2 discovery articles sequenced this location. This leaves open the possibility that the SARS-CoV-2 genomes circulating in September-November 2019, carrying features of the B.1 lineage, may have an RdRp CDS that does not evade these 2 MiRNA sequences. Consequently, these pre-pandemic genomes were unable to infect the human lung or lower respiratory tract, causing only very mild or asymptomatic illness, and therefore do not show up on the excess deaths curve or are likely to be enlisted into the subjects of an influenza surveillance program.
Where did B.1 come from anyway?
https://www.nature.com/articles/s41564-020-0770-5
One of the key arguments favoring “two zoonotic spillovers at the Huanan seafood market” as the origin of the SARS-CoV-2 A and B lineages is the apparent “exclusion” of potential intermediate genomes between them—genomes that carried only one of the 8782T/C and 28144C/T mutations that distinguish between the two lineages. However, while the “intermediate” genomes between A and B lineages have been recorded in numerous locations including Wuhan and Sichuan, with sequencing depths and qualities that do not warrant their exclusion from the phylogenetic tree analysis, The 3 tightly coupled mutations that define the B.1 lineage, C3037T, C14408T, and A23403G, with the addition of C241T, have so far eluded attempts at finding intermediate genomes that will bridge the B.1 lineage, now encompassing nearly all of the current circulating SARS-CoV-2 variant genomes, to the B lineage with single nucleotide changes between each other and lacked “Homoplastic mutation” to other genomes within the B or B.1 linage. It should also be noticed that the B.1 lineage was also first officially discovered in Italy.
The nucleocapsid protein and qRT-PCR
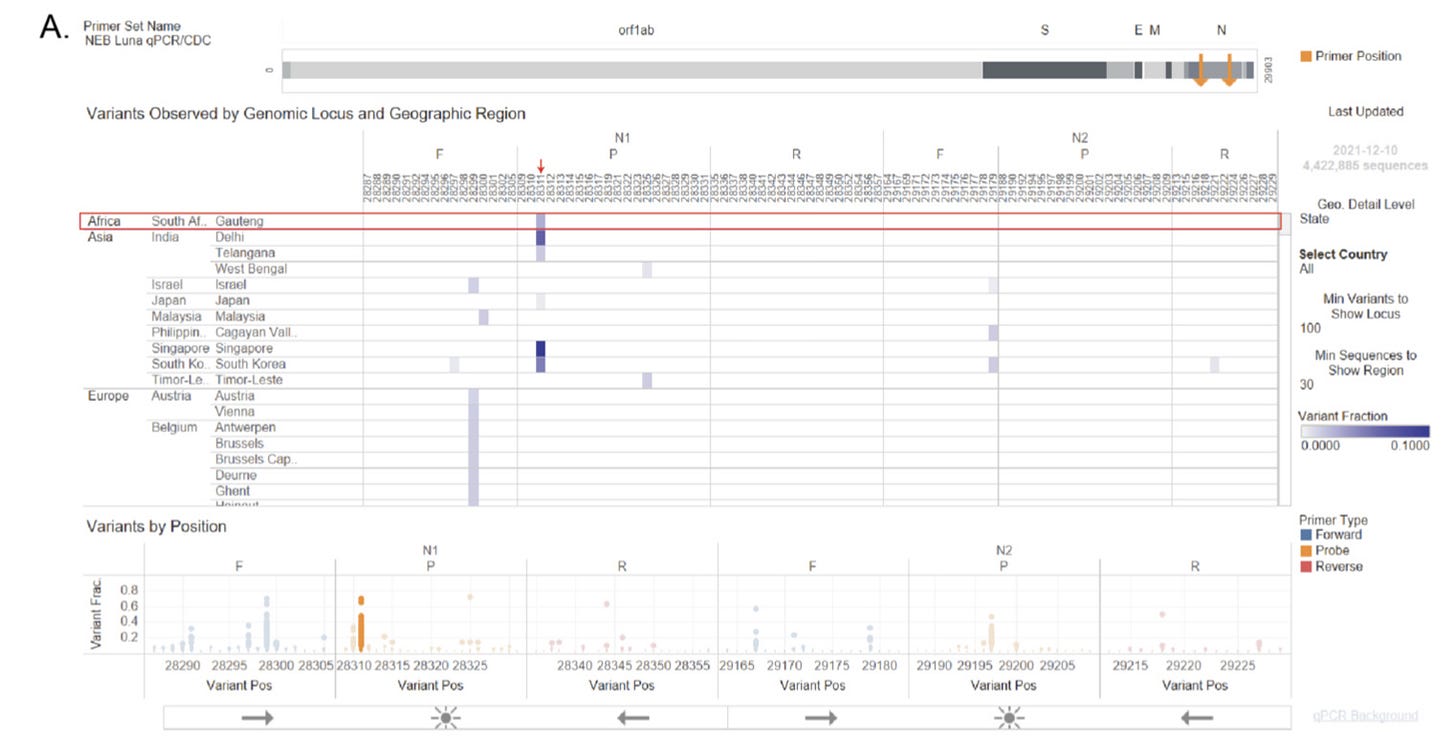
One of the other critiques of many early circulation discovery papers was that many failed to provide amplification with the “officially anointed” set of CDC primers in the qRT-PCR assay—which in many assays a positive test involves the amplification of at least one of the two sequences within the N protein CDS, the N1, and the N2 amplicons. However, analysis of the Omicron strain of SARS-CoV-2 indicates that some of the Omicron sequences possessed mutations at the 3’ end of either the N1-F or the N2-F primers, which would lead to failed amplification of that specific amplicon as DNA polymerases are highly sensitive to mismatches at the 3’-end of the primer-template hybrid. Should the common ancestor of B.1 and the Omicron lineage contain an N protein CDS that had mutations on both the N1-F and the N2-F primers, the CDC qRT-PCR assay will no longer turn positive during a test. Unfortunately, due to how current SARS-CoV-2 genomes are sampled and sequenced, such viral sequences are likely to stay unsampled for an extended period of time, accumulating a large number of mutations in the process, before recombination between the S protein CDS of such circulating strains and the Backbone sequence of a strain that does have an N protein CDS that can be amplified using the CDC qRT-PCR assay. This may also help explain the origin of the several major Omicron lineages, namely BA.1, BA.2, BA.3 as well as BA.2.75, and potentially BA.4/BA.5 and possibly other Variants-Of-Concern lineages such as Alpha (B.1.1.7) and Delta (B.1.617.2).
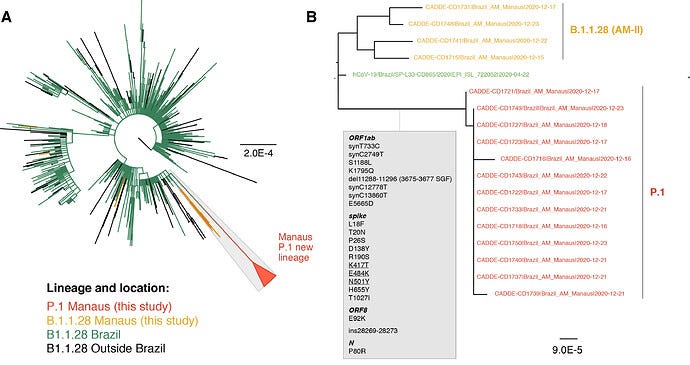
It should also be noticed that Brazil, one of the earliest locations where B.1-like sequences were being found through qRT-PCR, specific amplification of wastewater samples, and subsequent high-throughput sequencing, is also home to a highly divergent SARS-CoV-2 variant of concern, namely the Gamma/P.1 lineage.
The earliest strains of the B.1 and the A/B lineages
https://www.researchsquare.com/article/rs-1177047/v1
https://www.researchsquare.com/article/rs-1330800/v1
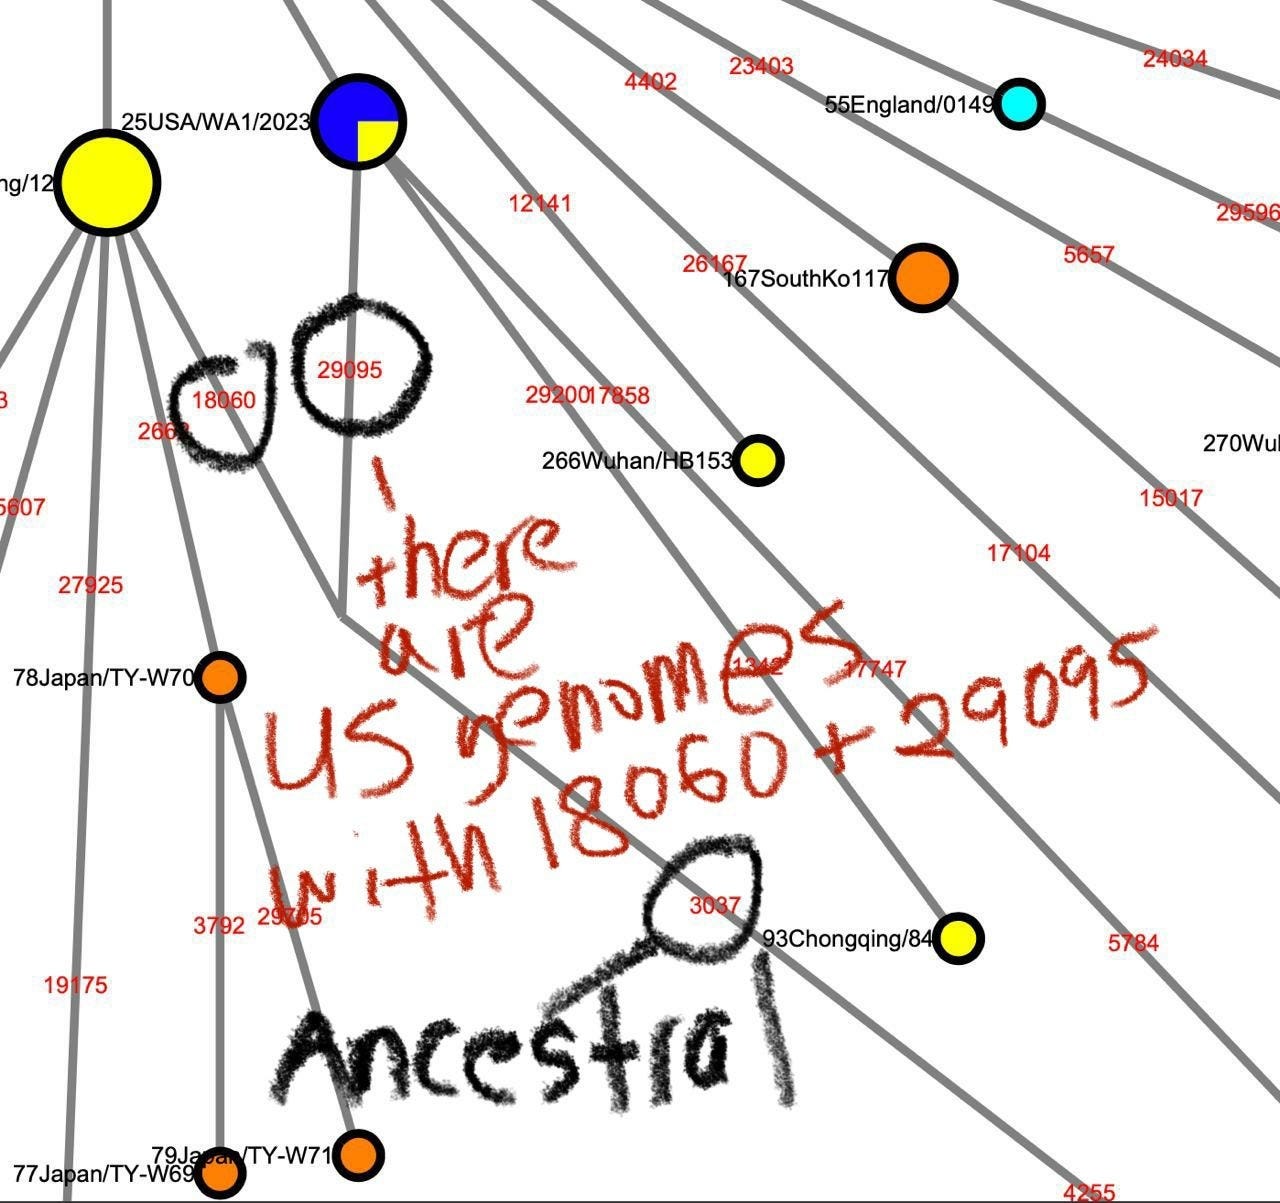
It is currently known that the most ancestral form of the A/B lineage SARS-CoV-2 is a genome carrying 8782T/28144C and either 18060T or 29095T. These genomes are not found in the earliest sampled cases that are found within or near the Huanan seafood market but were previously known to be sampled from the Washington State of the United States and Guangdong, respectively, as well as other locations in Wuhan.
However, with a coordinated search effort screening the short-read sequencing dataset from SARS-CoV-2 patients with the Twitter user @user3425664, we found that
one of the datasets sequenced from the P4 stock of USA/WA-1 derived from the ATCC’s P3 stock, SRR11393704, contained significant concentrations of T at position 29095, indicating that the putative ancestor of A/B lineage SARS-CoV-2 is found in North America.
The only other location where genomes containing 8782T,28144C,18060T, and 29095T can be found is within contaminated Antarctic samples (SRR13441704, SRR13441705, SRR13441708) sequenced sometime before the first sequencing of the Huanan market patient-derived SARS-CoV-2 genomes by the Wuhan Institute of Virology at the beginning of January 2020, likely sometime in December 2019, where the samples were found to contain approximately (rounding to the percent) 57% 8782T and 64% 28144C for SRR13441704, 33% 8782T and 71% 28144C for SRR13441705, 75% 8782T and 66% 28144C for SRR13441708. They also contained 37%, 33% and 46% 18060T. The 29095T is found SRR13441708 where 1 out of 37 spots with a match to at least one end of the read to the region containing 29095 contained 29095T.
In the case of 3037T, we also discovered several short-read sequencing datasets for SARS-CoV-2 isolated from English-speaking countries, where it is discovered with a significant presence within genomes that have dominant 8782T,28144C,18060T, and sometimes significant levels of 29095T, likely representing the last remnants of the ancestral 3037T position when epistasis favors the removal of 3037T as opposed to the selection of 241T, 14408T, and 23403G.
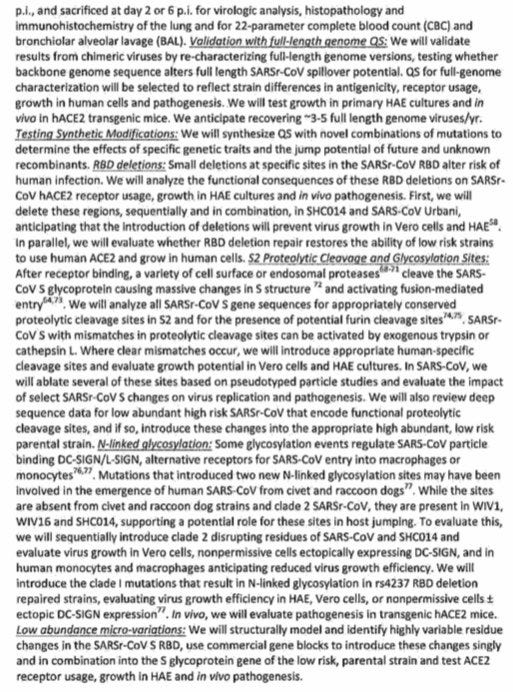
Spike protein RBD sequences that resemble Omicron and SARS-CoV-1 can sometimes be found in the wastewater metagenomic sequences in New York City, with notable changes H519N, N501T, Q498Y, Δ484, and N439K/F486V resembling the type of changes that are expected to be introduced into the “low-risk, parental strain” according to the “low-abundance micro-variations” goal of the 2018 Ecohealth DEFUSE proposal. If the Omicron VOC indeed diverged from a branch of B.1 before the advent of the Wuhan A/B lineages, the exceptionally high diversity of Spike protein RBDs found within the wastewater samples of the West coast of the United States may indicate that this location could have been the location where the Spike protein RBD sequences of current VOC lineages first diverged from, e.g., the location of origin for the B.1 lineage.
A likely timeline of events leading to the current SARS-CoV-2 pandemic
(Part 2: Is Omicron a distinct and independent serotype of SARS-CoV-2 that originated months before Wuhan?)








Welcome Daoyu15, great to have your awesome research here
Great job keep it up